
Tutorial: Read the Analytics Dashboard
This tutorial shows you how to find your experiment results, understand the key metrics, and use the data to make decisions about your variants.
Before you start
Section titled “Before you start”- You need a template with at least one experiment that has accumulated some traffic.
- If you’re just getting started, follow Create Your First Template and Generate Variants first.
Step 1: Navigate to your experiment results
Section titled “Step 1: Navigate to your experiment results”- Go to the Templates page at
https://console.justwords.ai/templates. - Click on the template you want to analyze.
- Navigate to the Studio tab — this is where your active experiment lives.
Step 2: Switch to Compact Mode
Section titled “Step 2: Switch to Compact Mode”For an at-a-glance performance summary, switch to Compact Mode in Studio. This view shows:
- The current experiment (control + active variants)
- Performance metrics for each variant
- Which variants are outperforming or underperforming
- Statistical significance indicators
Step 3: Understand key metrics
Section titled “Step 3: Understand key metrics”JustAI tracks several metrics for each variant. The one you selected as your Key Metric during template setup is used for optimization decisions.
| Metric | What it measures |
|---|---|
| Open rate | % of recipients who opened the email. Best for evaluating subject lines and preheaders. |
| Click rate | % of recipients who clicked a link. Best for evaluating CTAs and body content. |
| Conversion rate | % of recipients who completed a goal action (purchase, signup, etc.). Best for revenue-focused campaigns. |
| Sends | Total number of times each variant was served. Important context for significance. |
Reading the comparison
Section titled “Reading the comparison”Each variant’s metrics are shown relative to the control:
- Green / positive lift — the variant is outperforming the control
- Red / negative lift — the variant is underperforming the control
- Neutral — not enough data yet, or no meaningful difference
Step 4: Check for statistical significance
Section titled “Step 4: Check for statistical significance”JustAI evaluates statistical significance automatically. Look for:
- Significant results — the system has high confidence that the performance difference is real, not noise
- Not yet significant — more traffic is needed before drawing conclusions
A variant becomes eligible for Auto-Tune actions after 1,000 sends.
Step 5: Compare across attributes
Section titled “Step 5: Compare across attributes”If your template uses attributes for segmentation, you can see how variants perform across different audience segments. This reveals patterns like:
- Urgency themes work better for free-tier users
- Professional tone wins with enterprise segments
- Personalized subject lines outperform generic ones for returning users
These insights help you decide what themes and approaches to use in future variant generation.
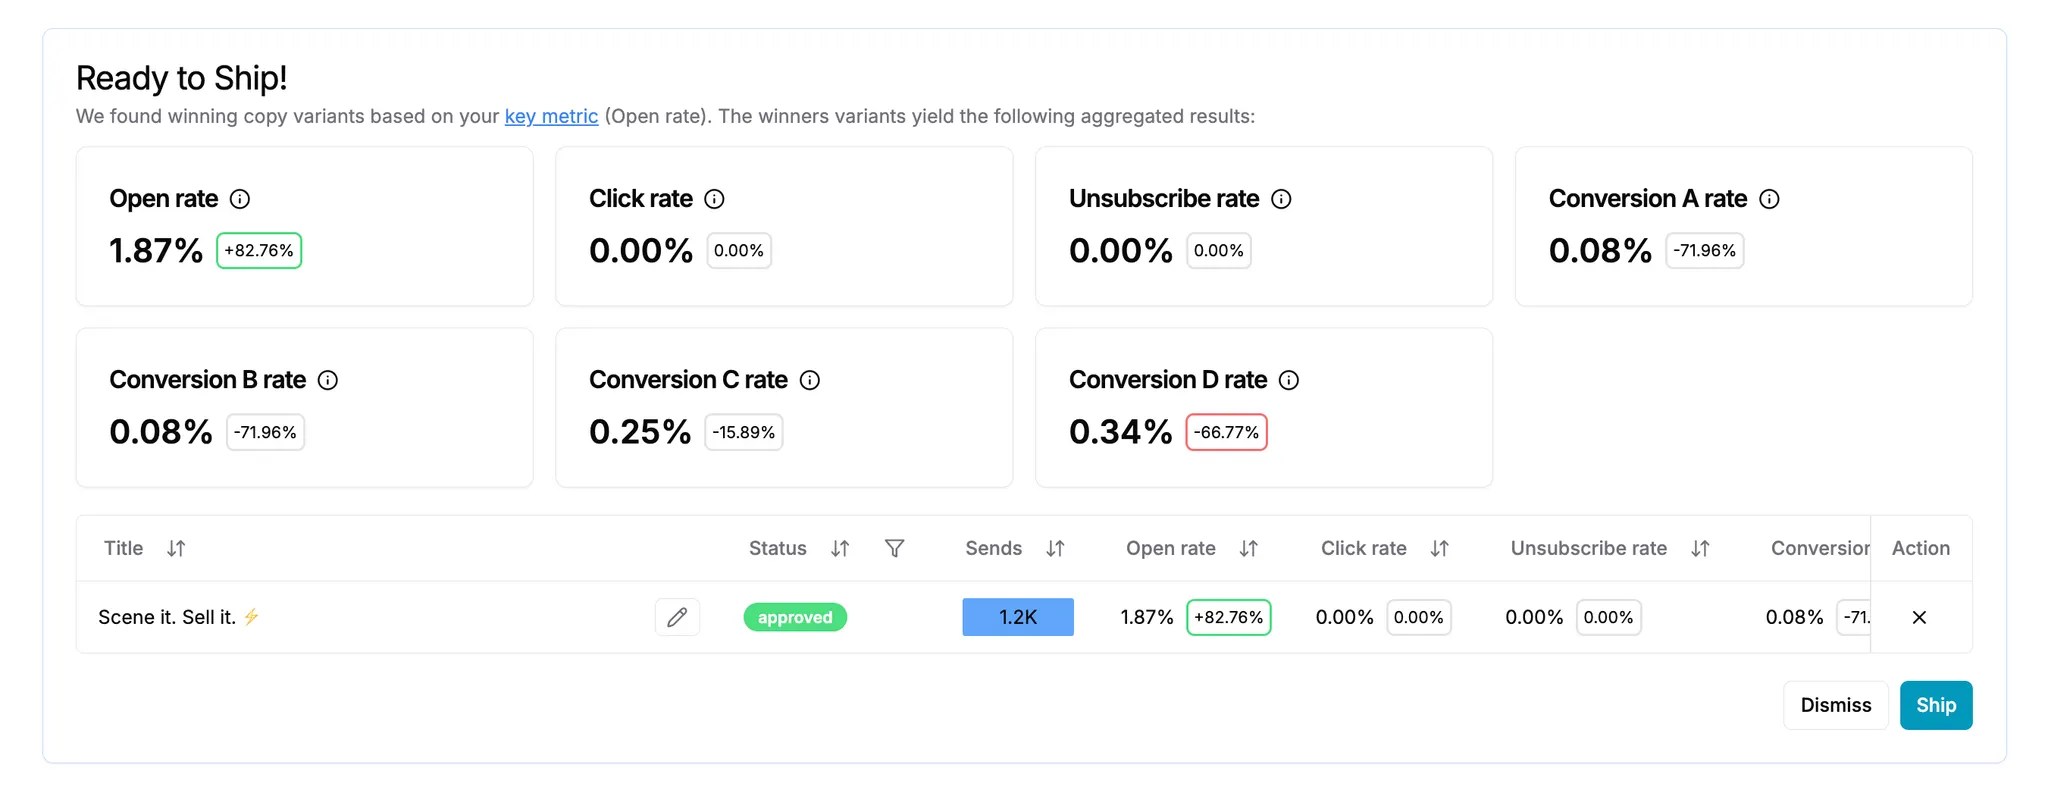
Step 6: Act on the results
Section titled “Step 6: Act on the results”Based on what you see, you have several options:
| Situation | Action |
|---|---|
| A variant is clearly winning | Ship it as the new control |
| A variant is underperforming | Archive it to stop sending it traffic |
| Results are mixed | Generate new variants with different approaches |
| Not enough data | Wait for more traffic to accumulate |
| Auto-Tune is enabled | Let JustAI handle it — it will archive losers and suggest new variants automatically |
What’s next
Section titled “What’s next”- Set Up Auto-Tune — automate the optimization loop
- Milestones & Shipping — ship winners and iterate
- Configure Org Settings — set up attributes and metrics for better segmentation